> ## Documentation Index
> Fetch the complete documentation index at: https://visionagents.ai/llms.txt
> Use this file to discover all available pages before exploring further.
# Kubernetes Deployment
> Deploy Vision Agents to Kubernetes with Helm — step-by-step guide
Deploy a Vision Agent to any Kubernetes cluster using the official Helm chart. This guide walks you through every step — from building a container image to seeing live metrics in Grafana.
## What you'll set up
* Agent running on Kubernetes with health checks
* Redis for session storage (bundled in the chart)
* Prometheus metrics scraping
* Grafana dashboard with live panels (sessions, latency, tokens)
## Prerequisites
| Tool | Install |
| ------------------------ | --------------------------------------------------------------------- |
| **Docker** | [docker.com](https://docs.docker.com/get-docker/) |
| **kubectl** | [kubernetes.io](https://kubernetes.io/docs/tasks/tools/) |
| **Helm** | `brew install helm` or [helm.sh](https://helm.sh/docs/intro/install/) |
| **A Kubernetes cluster** | Any: GKE, EKS, AKS, Minikube, OrbStack, Docker Desktop |
You'll also need API keys for the AI services:
```bash theme={null}
STREAM_API_KEY=...
STREAM_API_SECRET=...
DEEPGRAM_API_KEY=...
ELEVENLABS_API_KEY=...
GOOGLE_API_KEY=...
```
## Step 1: Get the example
Clone the repository and navigate to the deploy example:
```bash theme={null}
git clone https://github.com/GetStream/vision-agents.git
cd vision-agents/examples/07_k8s_deploy_example
```
## Step 2: Create your `.env` file
```bash theme={null}
cp .env.example .env
```
Edit `.env` and fill in your API keys.
## Step 3: Build the Docker image
Generate the lock file and build:
```bash theme={null}
uv lock
docker build -t vision-agent-deploy:latest -f Dockerfile .
```
If you're deploying to a cloud cluster (not local), you'll need to push the image to a container registry:
```bash theme={null}
docker tag vision-agent-deploy:latest YOUR_REGISTRY/vision-agent-deploy:latest
docker push YOUR_REGISTRY/vision-agent-deploy:latest
```
Then set `image.repository` in Step 5 accordingly.
## Step 4: Build Helm dependencies
The chart includes Redis as an optional bundled dependency:
```bash theme={null}
helm dependency build ./helm
```
## Step 5: Install
```bash theme={null}
helm install my-agent ./helm \
--set metrics.enabled=false \
--set grafana.enabled=false \
--set secrets.streamApiKey="$(grep '^STREAM_API_KEY=' .env | cut -d= -f2)" \
--set secrets.streamApiSecret="$(grep '^STREAM_API_SECRET=' .env | cut -d= -f2)" \
--set secrets.deepgramApiKey="$(grep '^DEEPGRAM_API_KEY=' .env | cut -d= -f2)" \
--set secrets.elevenlabsApiKey="$(grep '^ELEVENLABS_API_KEY=' .env | cut -d= -f2)" \
--set secrets.googleApiKey="$(grep '^GOOGLE_API_KEY=' .env | cut -d= -f2)"
```
We disable `metrics` and `grafana` for now because they require Prometheus CRDs (ServiceMonitor). We'll enable them in [Step 8](#step-8-monitoring-prometheus--grafana).
This deploys:
* **Agent** — Deployment with health probes, resource limits, and your API keys
* **Redis** — Standalone instance for session storage
* **Service** — ClusterIP for internal routing
* **Ingress** — External access (disabled by default, enable with `ingress.enabled=true` and set `ingress.host`)
## Step 6: Verify
Wait for pods to be ready:
```bash theme={null}
kubectl get pods -w
```
You should see two pods reach `1/1 Running`:
```
my-agent-redis-master-0 1/1 Running 0 30s
my-agent-vision-agent-xxxxx-xxxxx 1/1 Running 1 35s
```
The agent pod may restart once on first deploy. This happens because the agent tries to connect to Redis at startup, but Redis isn't ready yet. After the restart, Redis is up and everything works normally.
### Test the health endpoint
```bash theme={null}
kubectl port-forward svc/my-agent-vision-agent 8080:8080
```
In another terminal:
```bash theme={null}
curl -s -w "\nHTTP %{http_code}\n" http://localhost:8080/health
```
Expected: `HTTP 200`
### Create a session
```bash theme={null}
curl -s -X POST http://localhost:8080/calls/test-1/sessions \
-H "Content-Type: application/json" \
-d '{"call_type":"default"}' | python3 -m json.tool
```
Expected:
```json theme={null}
{
"session_id": "...",
"call_id": "test-1",
"session_started_at": "..."
}
```
## Step 7: Verify Redis
Check that the session was stored in Redis:
```bash theme={null}
REDIS_PASSWORD=$(kubectl get secret my-agent-redis -o jsonpath='{.data.redis-password}' | base64 -d) kubectl exec my-agent-redis-master-0 -- redis-cli -a "$REDIS_PASSWORD" KEYS '*'
```
Expected output:
```
vision_agents:sessions/test-1/
```
## Step 8: Monitoring (Prometheus + Grafana)
### Install the monitoring stack
This installs Prometheus + Grafana with CRDs for ServiceMonitor:
```bash theme={null}
helm repo add prometheus-community https://prometheus-community.github.io/helm-charts
helm install monitoring prometheus-community/kube-prometheus-stack \
--set grafana.adminPassword=admin \
--set prometheus.prometheusSpec.retention=2h \
--set alertmanager.enabled=false
```
### Enable metrics in the agent chart
Now upgrade with metrics and Grafana dashboard enabled:
```bash theme={null}
helm upgrade my-agent ./helm \
--set metrics.additionalLabels.release=monitoring \
--set secrets.streamApiKey="$(grep '^STREAM_API_KEY=' .env | cut -d= -f2)" \
--set secrets.streamApiSecret="$(grep '^STREAM_API_SECRET=' .env | cut -d= -f2)" \
--set secrets.deepgramApiKey="$(grep '^DEEPGRAM_API_KEY=' .env | cut -d= -f2)" \
--set secrets.elevenlabsApiKey="$(grep '^ELEVENLABS_API_KEY=' .env | cut -d= -f2)" \
--set secrets.googleApiKey="$(grep '^GOOGLE_API_KEY=' .env | cut -d= -f2)"
```
`metrics.additionalLabels.release=monitoring` is required so Prometheus discovers the ServiceMonitor. The label must match your Prometheus `serviceMonitorSelector` — for `kube-prometheus-stack`, it's `release: `.
This adds:
* **ServiceMonitor** — tells Prometheus to scrape `/metrics` on the agent pods
* **Grafana Dashboard** — auto-provisioned via ConfigMap sidecar
### Open Grafana
```bash theme={null}
kubectl port-forward svc/monitoring-grafana 3000:80
```
If you see `pod is not running. Current status=Pending`, wait a moment for the Grafana pod to start and retry. The monitoring stack takes a bit longer to initialize than the agent.
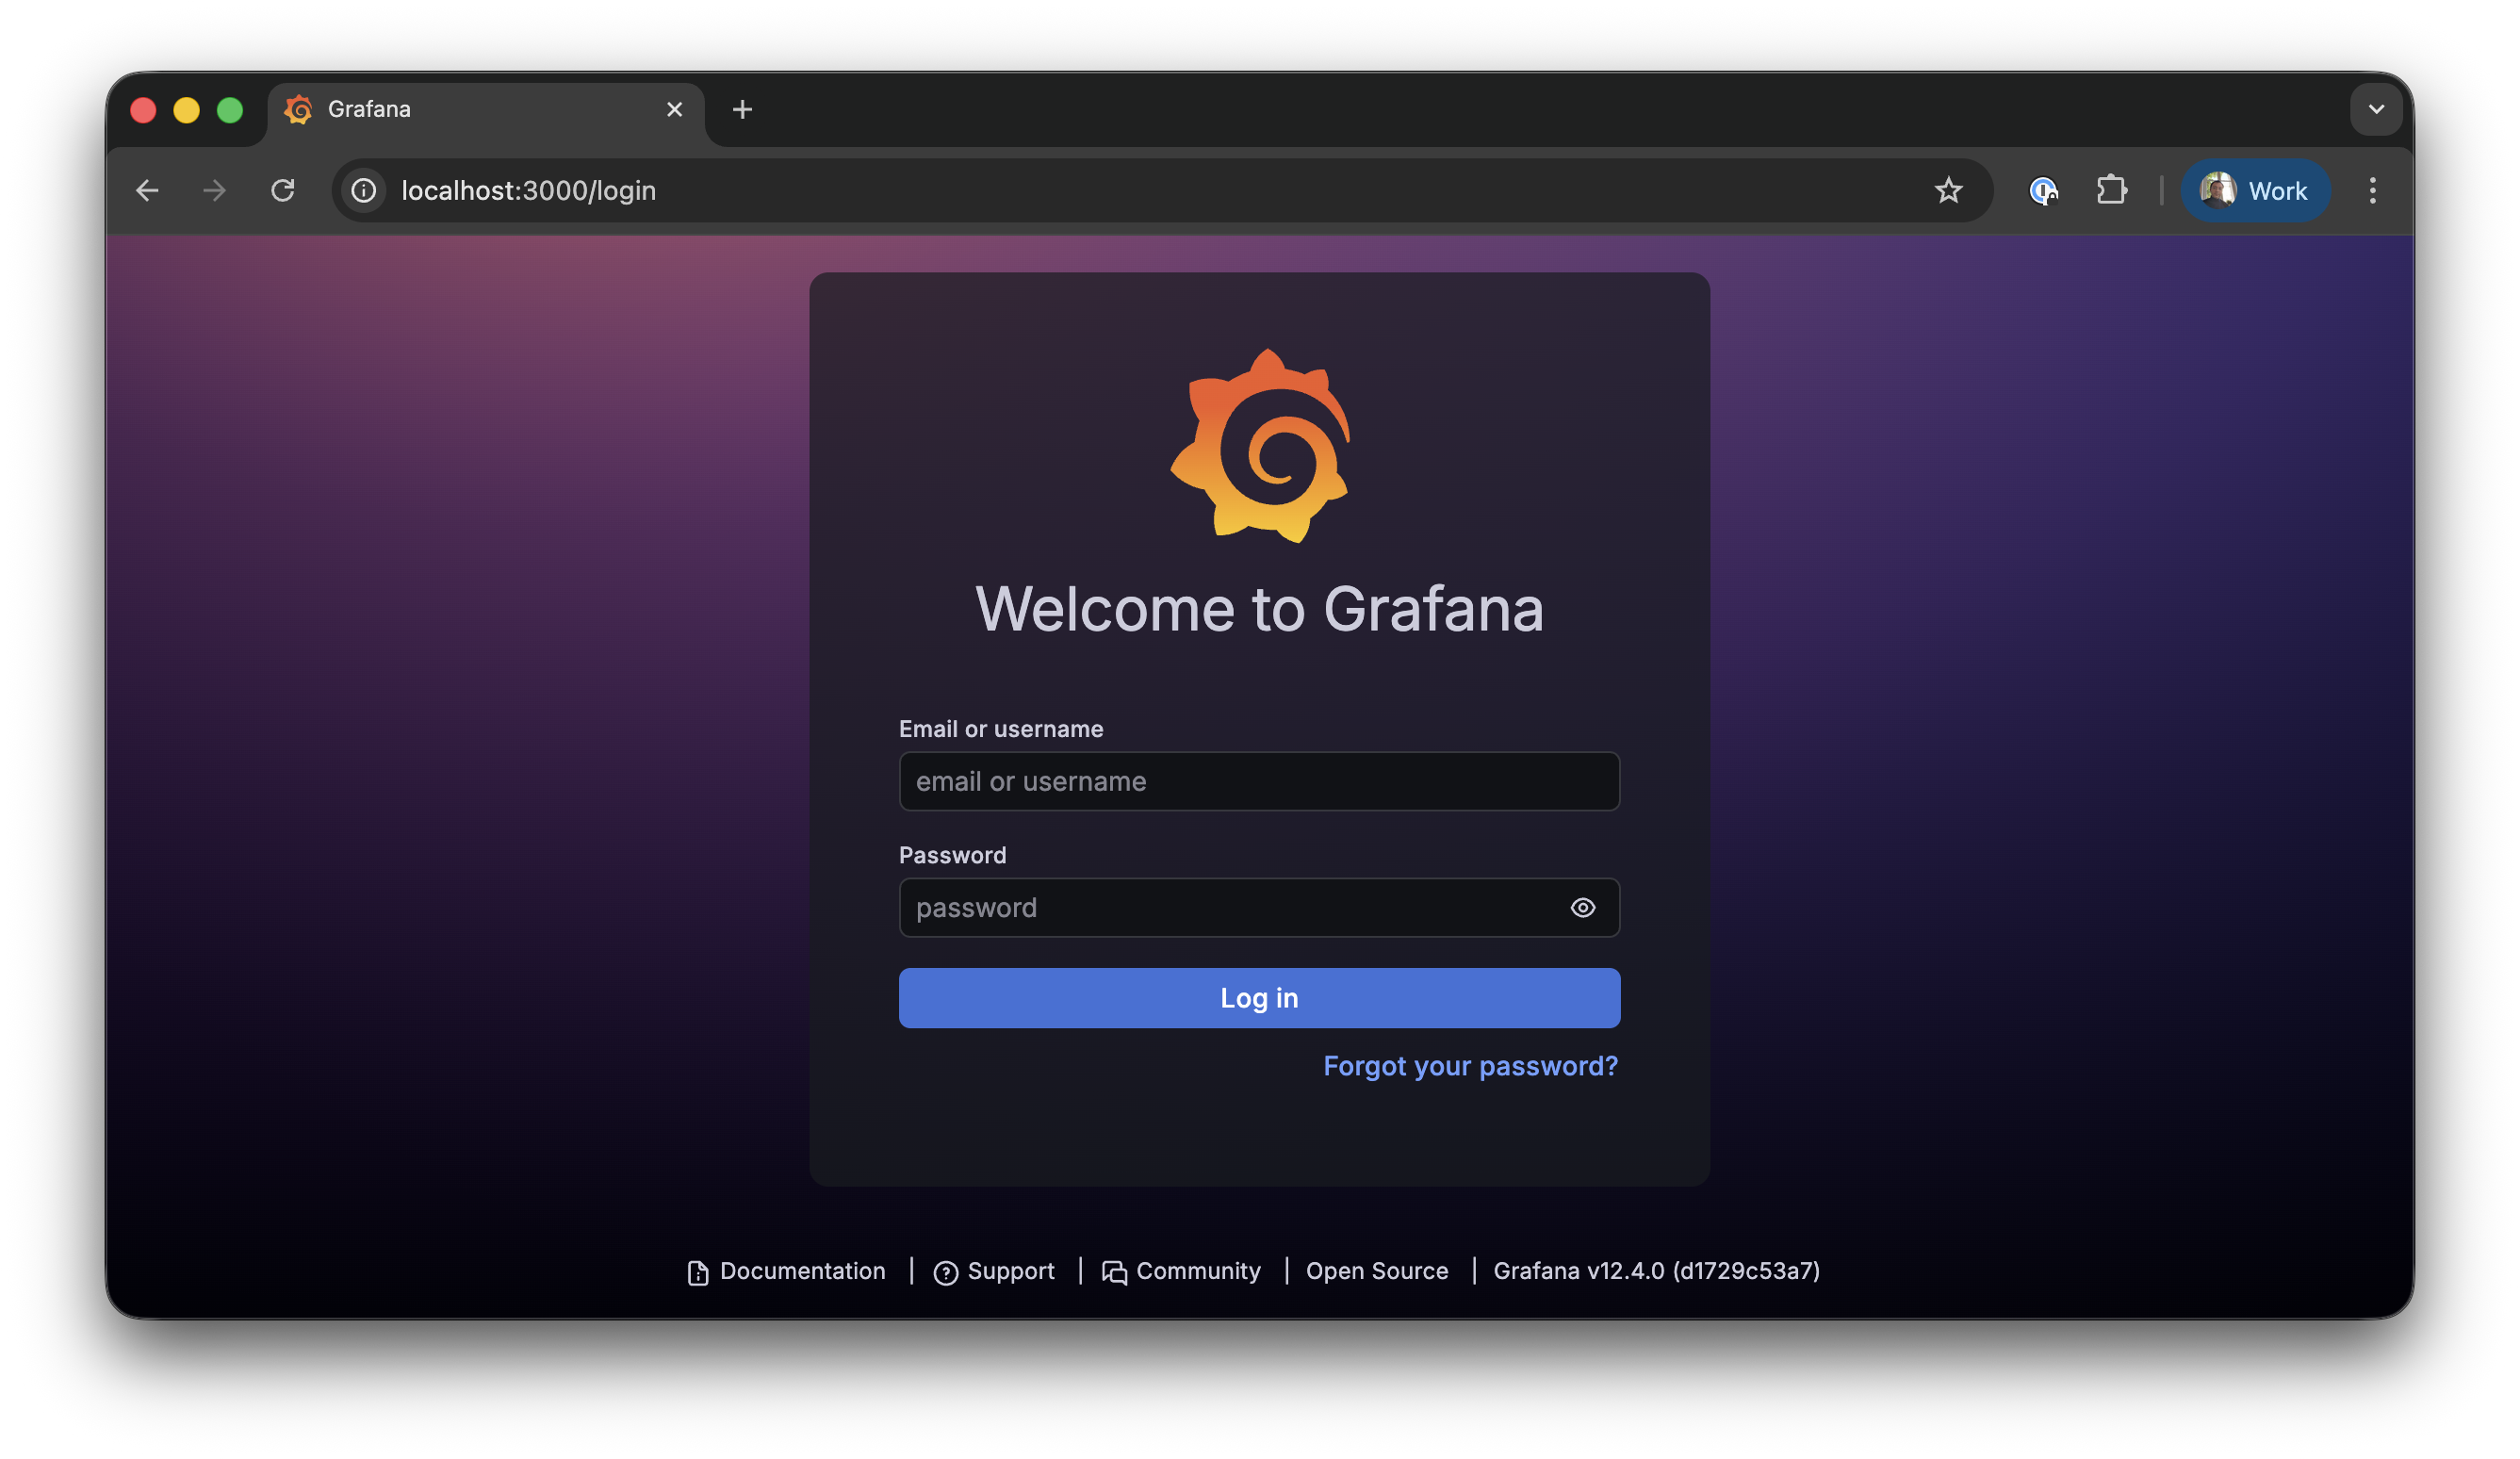
Open [http://localhost:3000](http://localhost:3000) — you'll see the Grafana login screen. Enter `admin` / `admin`.
 Navigate to **Dashboards → Vision Agent Overview**.
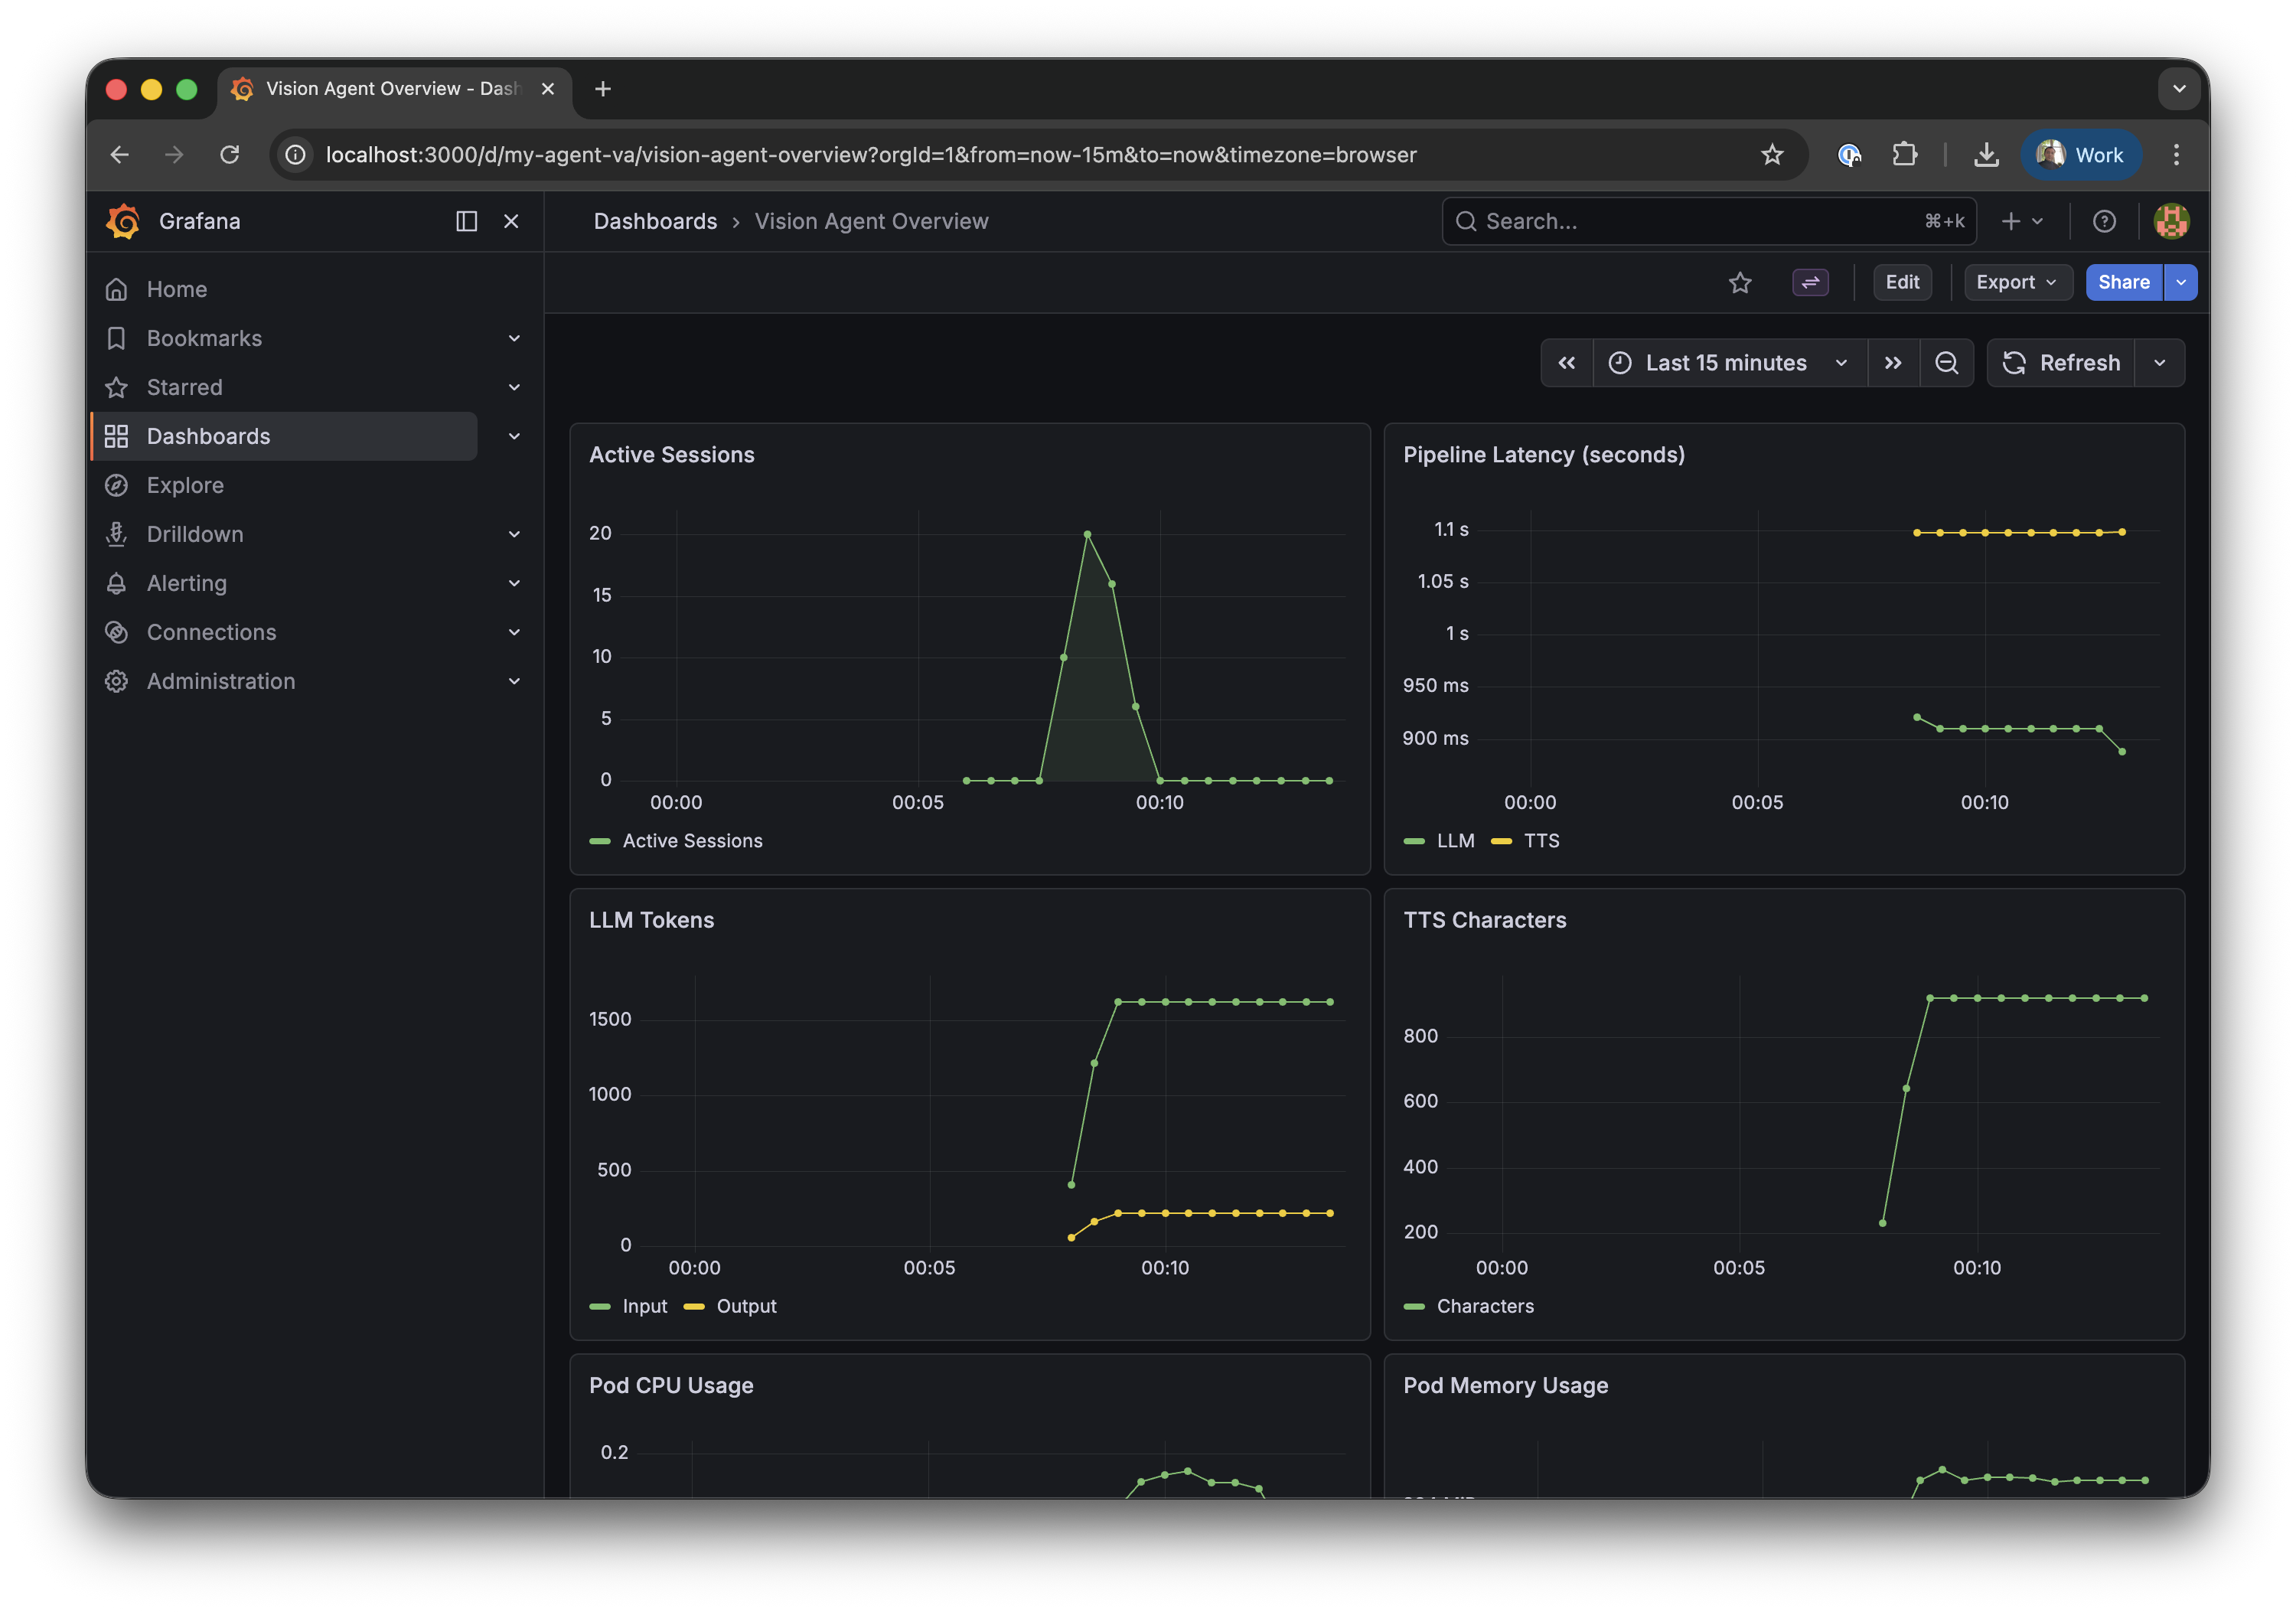
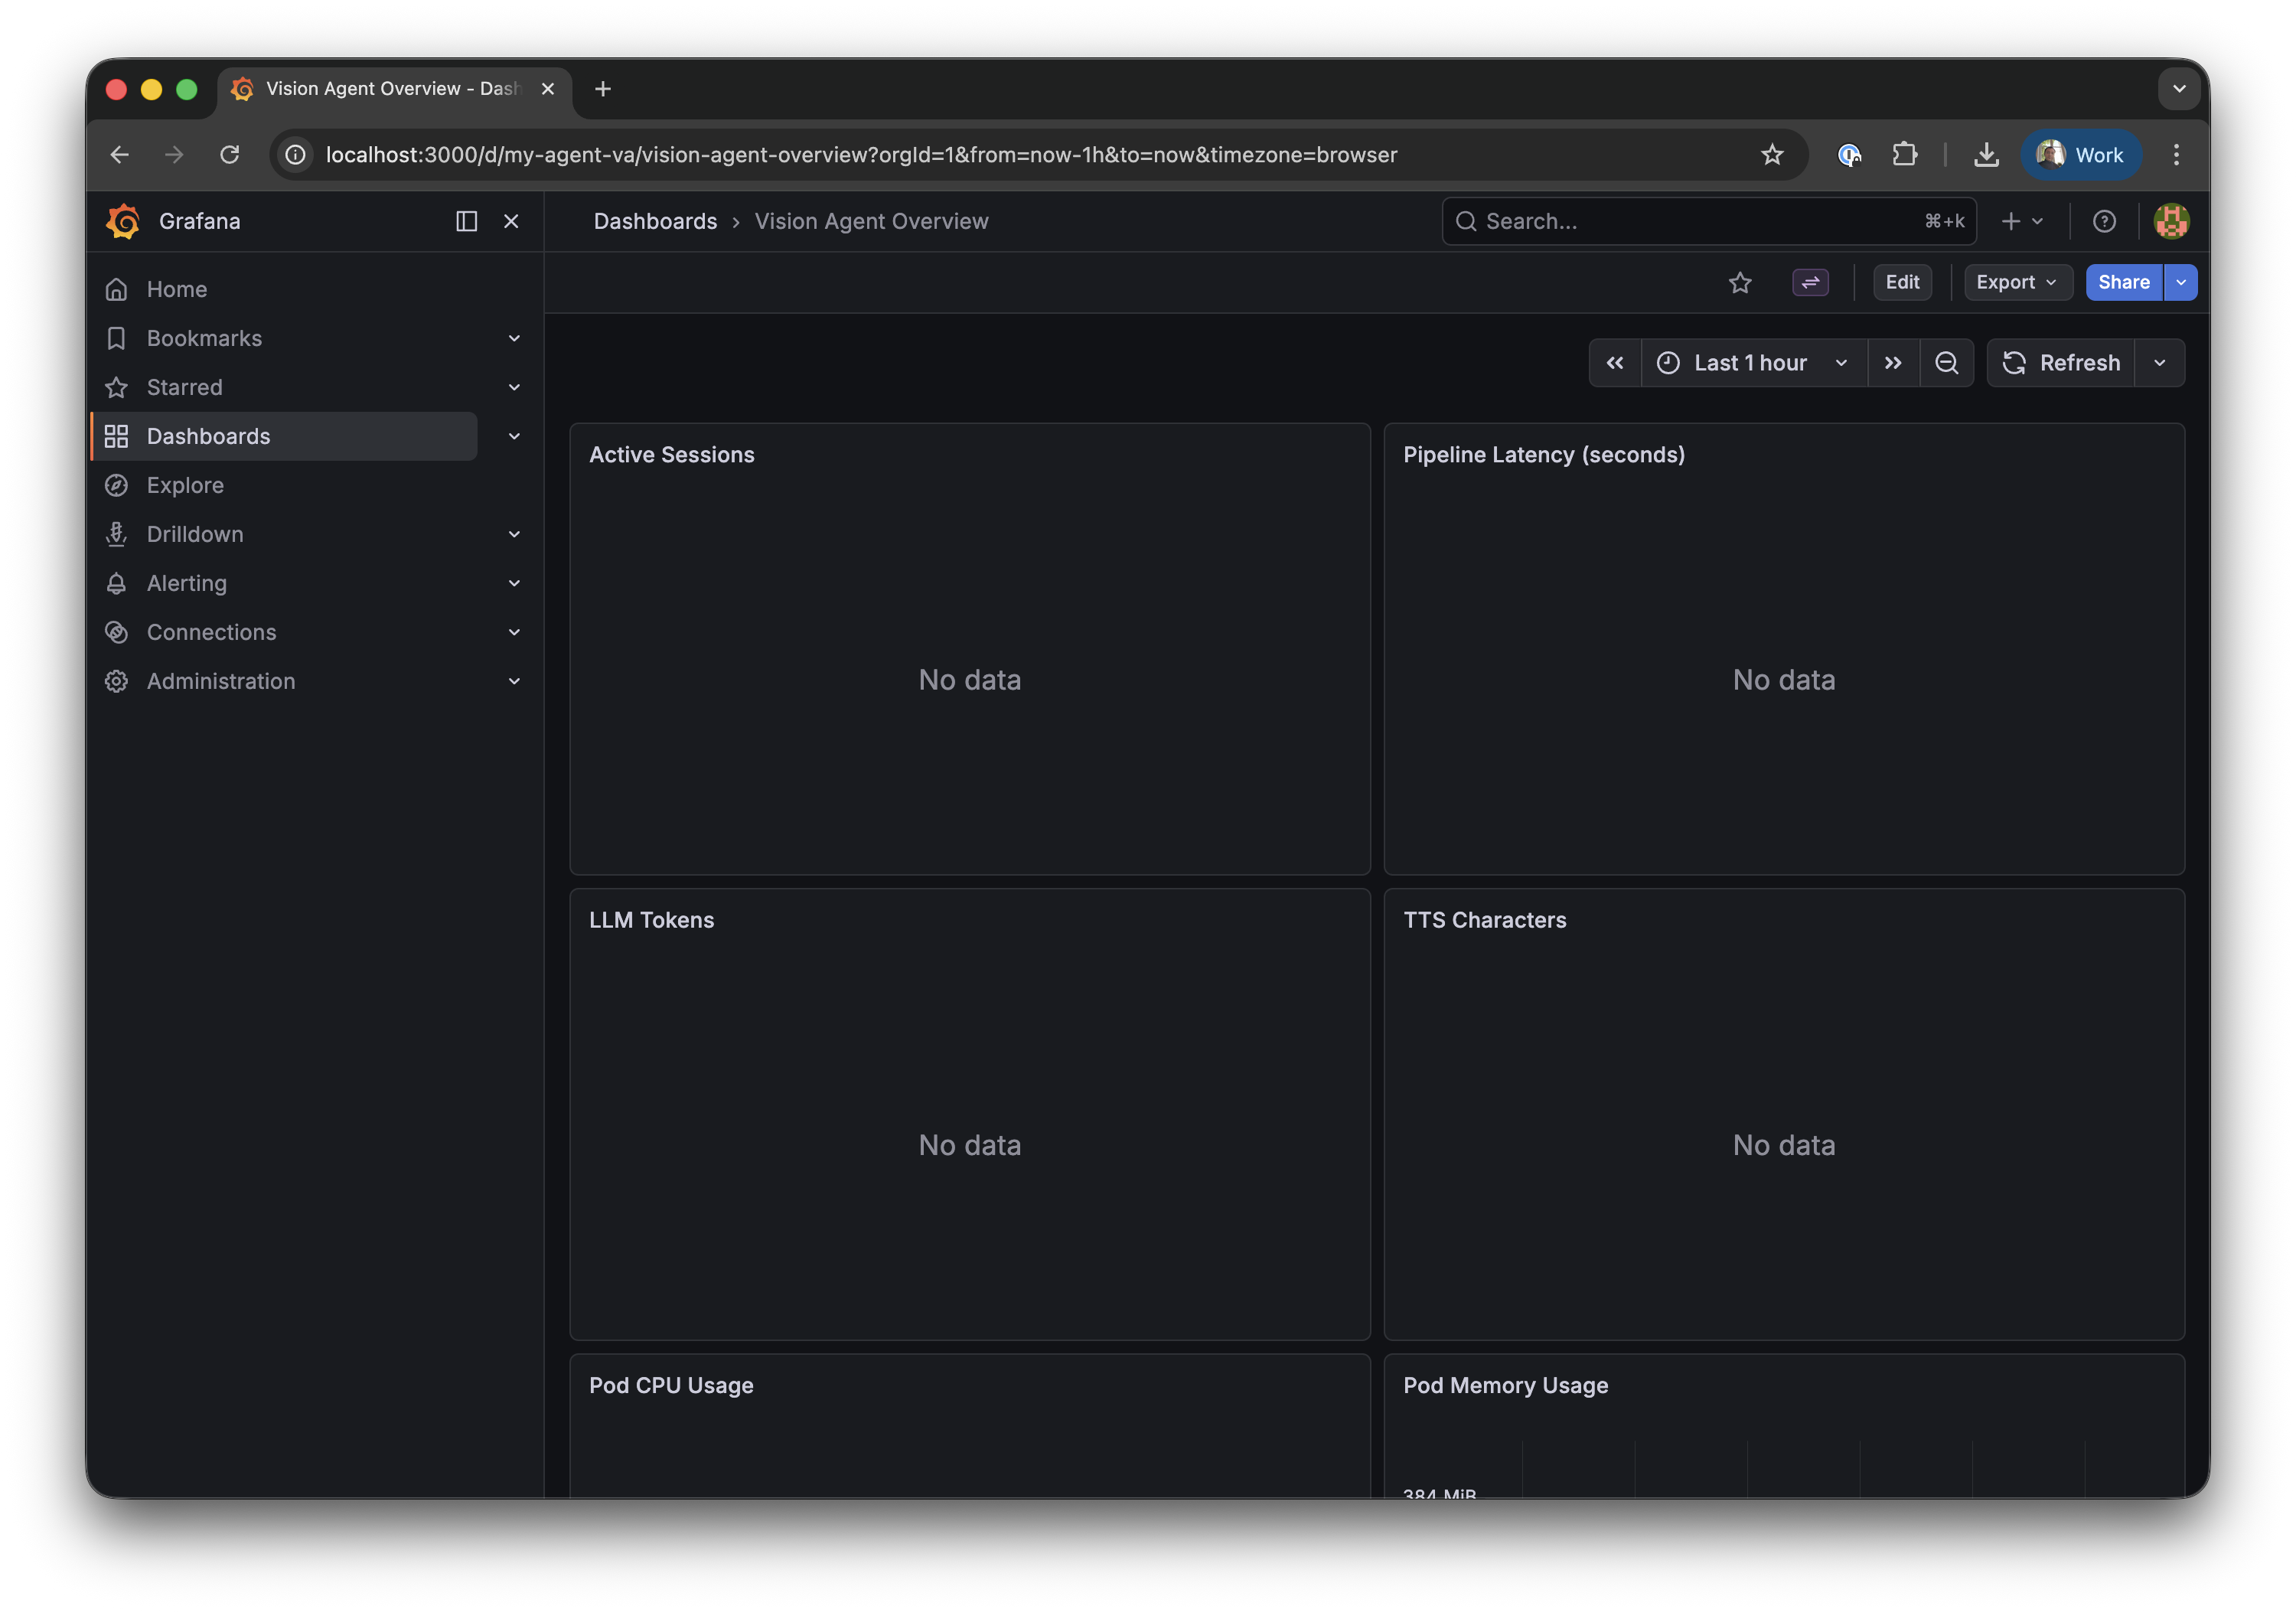 You'll see 7 panels:
| Row | Left | Right |
| --- | --------------------------------------------------- | -------------------------------------------- |
| 1 | Active Sessions | Pipeline Latency (STT / LLM / TTS) |
| 2 | LLM Tokens (input / output) | TTS Characters |
| 3 | Pod CPU Usage (not visible on screenshot) | Pod Memory Usage (not visible on screenshot) |
| 4 | LLM Time to First Token (not visible on screenshot) | — |
### Generate some data
Create test sessions to verify the metrics pipeline works end-to-end. The 3-second delay between sessions ensures Prometheus captures active session counts between its 30-second scrape intervals:
```bash theme={null}
for i in $(seq 1 20); do
curl -s -X POST http://localhost:8080/calls/load-test-$i/sessions \
-H "Content-Type: application/json" \
-d '{"call_type":"default"}'
sleep 3
done
```
The **Pod CPU Usage** and **Pod Memory Usage** panels will show data immediately since they use cluster-level metrics. The application-level panels (Active Sessions, Latency, Tokens) will populate as sessions run through the pipeline.
For sustained, non-zero application metrics, connect a real client via the Stream Video SDK. Test sessions created via curl are short-lived and may complete between Prometheus scrape intervals (30s).
You'll see 7 panels:
| Row | Left | Right |
| --- | --------------------------------------------------- | -------------------------------------------- |
| 1 | Active Sessions | Pipeline Latency (STT / LLM / TTS) |
| 2 | LLM Tokens (input / output) | TTS Characters |
| 3 | Pod CPU Usage (not visible on screenshot) | Pod Memory Usage (not visible on screenshot) |
| 4 | LLM Time to First Token (not visible on screenshot) | — |
### Generate some data
Create test sessions to verify the metrics pipeline works end-to-end. The 3-second delay between sessions ensures Prometheus captures active session counts between its 30-second scrape intervals:
```bash theme={null}
for i in $(seq 1 20); do
curl -s -X POST http://localhost:8080/calls/load-test-$i/sessions \
-H "Content-Type: application/json" \
-d '{"call_type":"default"}'
sleep 3
done
```
The **Pod CPU Usage** and **Pod Memory Usage** panels will show data immediately since they use cluster-level metrics. The application-level panels (Active Sessions, Latency, Tokens) will populate as sessions run through the pipeline.
For sustained, non-zero application metrics, connect a real client via the Stream Video SDK. Test sessions created via curl are short-lived and may complete between Prometheus scrape intervals (30s).
 ## Configuration reference
### `values.yaml` — key settings
| Setting | Default | Description |
| -------------------------- | --------------------- | ------------------------------------------------------ |
| `replicaCount` | `1` | Number of agent pods |
| `image.repository` | `vision-agent-deploy` | Container image |
| `image.tag` | `latest` | Image tag |
| `containerPort` | `8080` | Application port |
| `redis.deploy.enabled` | `true` | Deploy Redis alongside the agent |
| `redis.auth.enabled` | `true` | Enable Redis authentication (bundled Redis) |
| `redis.url` | `""` | External Redis URL (when `deploy.enabled=false`) |
| `ingress.enabled` | `false` | Create an Ingress resource (requires `host` to be set) |
| `ingress.className` | `""` | Ingress class (nginx, traefik, etc.) |
| `ingress.host` | `""` | Domain name |
| `metrics.enabled` | `true` | Create ServiceMonitor for Prometheus |
| `metrics.additionalLabels` | `{}` | Extra labels on ServiceMonitor |
| `grafana.enabled` | `true` | Deploy Grafana dashboard ConfigMap |
| `gpu.enabled` | `false` | Switch to GPU resources and tolerations |
| `cache.enabled` | `true` | Persistent volume for uv package cache |
| `secrets.existingSecret` | `""` | Use a pre-created Secret instead |
### Using managed Redis (production)
For production, use a managed Redis service instead of the bundled one:
```bash theme={null}
helm install my-agent ./helm \
--set redis.deploy.enabled=false \
--set redis.url="rediss://:AUTH@your-redis-host:6380/0" \
--set secrets.existingSecret=my-api-keys
```
### Using a custom domain
```bash theme={null}
helm install my-agent ./helm \
--set ingress.className=nginx \
--set ingress.host=agent.example.com \
--set ingress.tls[0].secretName=agent-tls \
--set ingress.tls[0].hosts[0]=agent.example.com
```
## Troubleshooting
### Pod crashes immediately — `uv.lock` not found
You need to generate the lock file before building:
```bash theme={null}
uv lock
docker build -t vision-agent-deploy:latest -f Dockerfile .
```
### Server listens on `127.0.0.1` — probes fail
The Dockerfile must use `--host 0.0.0.0`:
```dockerfile theme={null}
CMD ["sh", "-c", "uv sync --frozen && exec uv run deploy_example.py serve --host 0.0.0.0 --port 8080"]
```
Without `--host 0.0.0.0`, the server only accepts connections from inside the container, and Kubernetes health probes can't reach it.
### ServiceMonitor exists but Prometheus doesn't scrape
Prometheus only watches ServiceMonitors with matching labels. Check what your Prometheus expects:
```bash theme={null}
kubectl get prometheus -o jsonpath='{.items[0].spec.serviceMonitorSelector}'
```
Then add the required label:
```bash theme={null}
helm upgrade my-agent ./helm \
--set metrics.additionalLabels.release=monitoring
```
### Grafana dashboard shows "No data"
1. Check Prometheus is scraping: open [http://localhost:9090/targets](http://localhost:9090/targets) (port-forward Prometheus first)
2. Check the metric exists: in Grafana **Explore**, query `ai_demo_active_sessions`
3. If data shows in Explore but not the dashboard — restart Grafana to reload ConfigMaps:
```bash theme={null}
kubectl delete pod -l app.kubernetes.io/name=grafana
```
## Cleanup
Remove everything:
```bash theme={null}
helm uninstall my-agent
helm uninstall monitoring
kubectl delete pvc --all
```
## Next steps
API endpoints, session limits, and CORS configuration
Multi-replica deployment with Redis session registry
OpenTelemetry metrics reference and Prometheus queries
Docker, GPU, and general deployment tips
## Configuration reference
### `values.yaml` — key settings
| Setting | Default | Description |
| -------------------------- | --------------------- | ------------------------------------------------------ |
| `replicaCount` | `1` | Number of agent pods |
| `image.repository` | `vision-agent-deploy` | Container image |
| `image.tag` | `latest` | Image tag |
| `containerPort` | `8080` | Application port |
| `redis.deploy.enabled` | `true` | Deploy Redis alongside the agent |
| `redis.auth.enabled` | `true` | Enable Redis authentication (bundled Redis) |
| `redis.url` | `""` | External Redis URL (when `deploy.enabled=false`) |
| `ingress.enabled` | `false` | Create an Ingress resource (requires `host` to be set) |
| `ingress.className` | `""` | Ingress class (nginx, traefik, etc.) |
| `ingress.host` | `""` | Domain name |
| `metrics.enabled` | `true` | Create ServiceMonitor for Prometheus |
| `metrics.additionalLabels` | `{}` | Extra labels on ServiceMonitor |
| `grafana.enabled` | `true` | Deploy Grafana dashboard ConfigMap |
| `gpu.enabled` | `false` | Switch to GPU resources and tolerations |
| `cache.enabled` | `true` | Persistent volume for uv package cache |
| `secrets.existingSecret` | `""` | Use a pre-created Secret instead |
### Using managed Redis (production)
For production, use a managed Redis service instead of the bundled one:
```bash theme={null}
helm install my-agent ./helm \
--set redis.deploy.enabled=false \
--set redis.url="rediss://:AUTH@your-redis-host:6380/0" \
--set secrets.existingSecret=my-api-keys
```
### Using a custom domain
```bash theme={null}
helm install my-agent ./helm \
--set ingress.className=nginx \
--set ingress.host=agent.example.com \
--set ingress.tls[0].secretName=agent-tls \
--set ingress.tls[0].hosts[0]=agent.example.com
```
## Troubleshooting
### Pod crashes immediately — `uv.lock` not found
You need to generate the lock file before building:
```bash theme={null}
uv lock
docker build -t vision-agent-deploy:latest -f Dockerfile .
```
### Server listens on `127.0.0.1` — probes fail
The Dockerfile must use `--host 0.0.0.0`:
```dockerfile theme={null}
CMD ["sh", "-c", "uv sync --frozen && exec uv run deploy_example.py serve --host 0.0.0.0 --port 8080"]
```
Without `--host 0.0.0.0`, the server only accepts connections from inside the container, and Kubernetes health probes can't reach it.
### ServiceMonitor exists but Prometheus doesn't scrape
Prometheus only watches ServiceMonitors with matching labels. Check what your Prometheus expects:
```bash theme={null}
kubectl get prometheus -o jsonpath='{.items[0].spec.serviceMonitorSelector}'
```
Then add the required label:
```bash theme={null}
helm upgrade my-agent ./helm \
--set metrics.additionalLabels.release=monitoring
```
### Grafana dashboard shows "No data"
1. Check Prometheus is scraping: open [http://localhost:9090/targets](http://localhost:9090/targets) (port-forward Prometheus first)
2. Check the metric exists: in Grafana **Explore**, query `ai_demo_active_sessions`
3. If data shows in Explore but not the dashboard — restart Grafana to reload ConfigMaps:
```bash theme={null}
kubectl delete pod -l app.kubernetes.io/name=grafana
```
## Cleanup
Remove everything:
```bash theme={null}
helm uninstall my-agent
helm uninstall monitoring
kubectl delete pvc --all
```
## Next steps
API endpoints, session limits, and CORS configuration
Multi-replica deployment with Redis session registry
OpenTelemetry metrics reference and Prometheus queries
Docker, GPU, and general deployment tips